We often ask: “Did that exhibition actually move the needle?”
Or “Was that PR push just noise—or did it change something?”
Enter the Causality Report—your visibility tool into the ripple effects of real-world business actions on digital performance metrics like impressions, clicks, or ad performance.
What Is a Causality Report?
A causality report visualizes the before-and-after impact of a specific business event—like:
- Participating in an exhibition
- Launching a new product
- Publishing a major press release
- Announcing funding or awards
- Running a co-marketing campaign
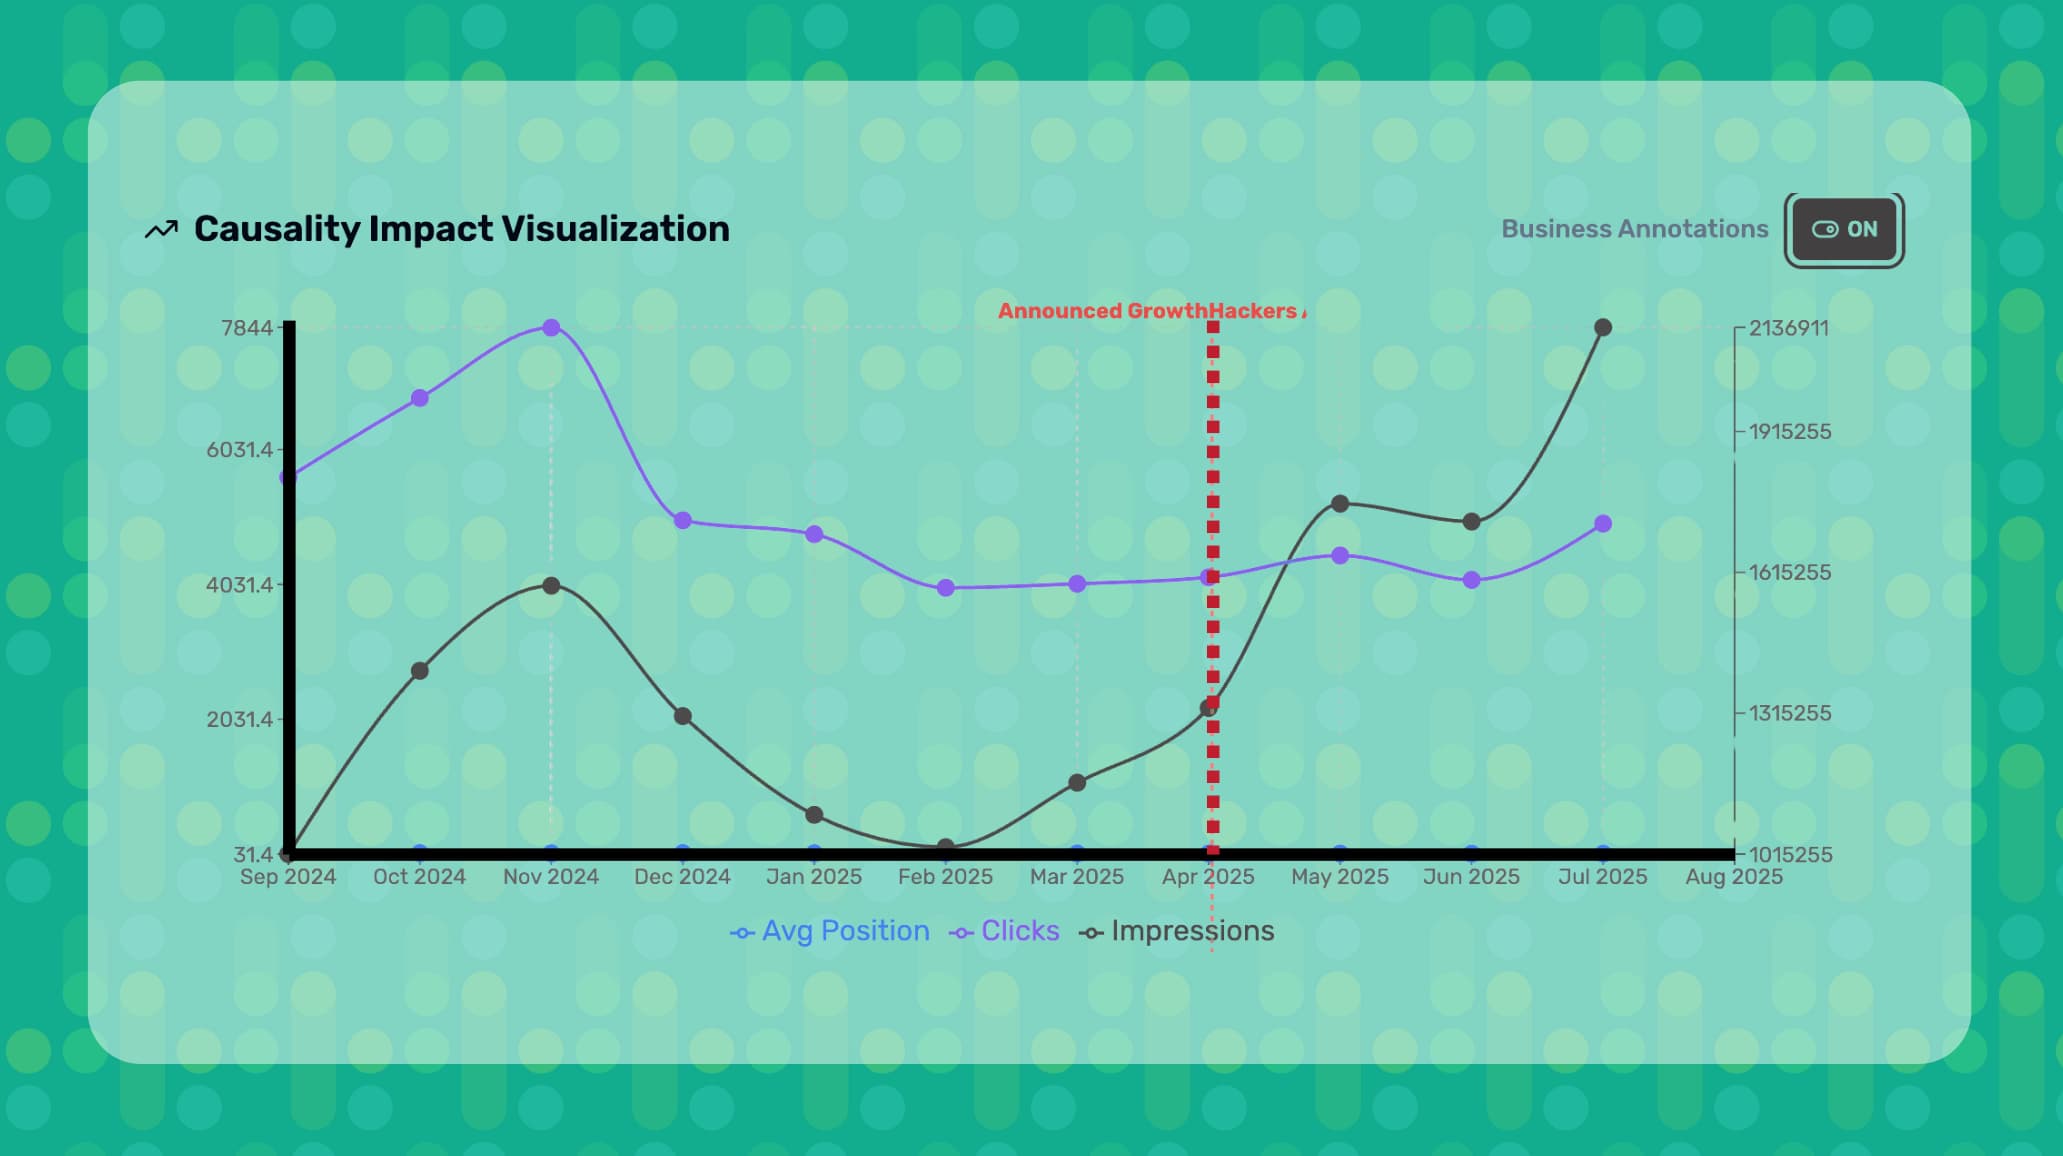
You annotate the exact date of the event (e.g. April 2025 in this chart), and then track how key metrics evolve. This isn’t just correlation—it’s evidence.
Why It Matters
In the chart above, a clear shift happens right after April 2025:
- Impressions spike
- Clicks start recovering
- Average Position remains stable (suggesting ranking wasn’t the driver—visibility was)
That’s not a coincidence. It’s a signal. Your business action created impact.
The Goldmine: Data-Driven Business Intuition
Most companies separate “marketing” and “business ops.” But when you connect the dots:
- A PR campaign isn’t just exposure—it’s upstream influence on impressions.
- A conference speech may not drive direct sales, but it moves the brand needle.
- A funding round might trigger algorithmic shifts in search intent and mentions.
If you’re not correlating this kind of data, you’re leaving business intelligence on the table.
When to Use It
Use causality reporting to:
- Justify ROI on branding and awareness initiatives
- Learn which types of events drive lasting impact
- Find lags between activity and results (e.g. press vs. clicks)
- Optimize your future marketing calendar around what actually works
The “Business Annotations ON” toggle shown in the chart isn’t just a UI feature—it’s a strategic layer. It turns passive data into narrative intelligence. You stop just reporting metrics—and start telling stories.
